PSRR becomes a major problem with poorly-designed control loops.
Introduction
Modern power converters are moving towards high efficiency, high density, and high switching frequencies. Vendors of power supplies are doing an outstanding job of meeting these goals with a range of new technologies. At the same time, despite the use of advanced control chip technology, many control loops have suffered a quantum drop in performance, and this is showing up as a problem with the power supply rejection ratio (PSRR).
Power Supply PSRR Measurements
When I first started working in power supplies, design and test procedures were based on rigorous military and aerospace testing standards. For switching power supplies, the important measurements to collect were loop gains, output impedance, and audiosusceptibility (often referred to as power supply rejection ration, or PSRR, these days.) Loop gains were easy to make, just involving cutting a trace on a board and injecting small test signals. Output impedance can be tougher, depending on the power level of the supply being tested, as significant current must be driven into the output terminals for low impedance systems.
PSRR is also hard to measure since the input line must be broken, and signal added to the input dc bus. Details of how to make these measurements are given in [1]. We make PSRR measurements in order to predict how much noise gets through to the output of the power supply from the input bus. Shortly after the start of the 1980s, current-mode control became widespread in the power supply industry, and measurements of PSRR became less common in the following years. Why? Because the noise rejection using current-mode control was so outstanding that there was really no need to measure it any more.
Recently, however, PSRR has again become an important measurement. The only reason for this to suddenly re-emerge as a concern is because many power supplies are being designed with poor performance in this regard. Noise on the input voltage rail disturbs the output sufficiently to create regulation issues and system failures.
Four events have led to deteriorated PSRR performance:
Demand for high density has raised the switching frequencies.
MLC capacitors with very low ESRs are now available with high value capacitance.
Inductor values have reduced to minimize size.
Digital controllers are becoming more and more widespread.
Paradoxically, all of these events should be producing much better control performance, but things have become worse in many cases. If the technology is implemented properly, they can do much better but this is usually not the case.
Voltage-Mode PSRR Performance
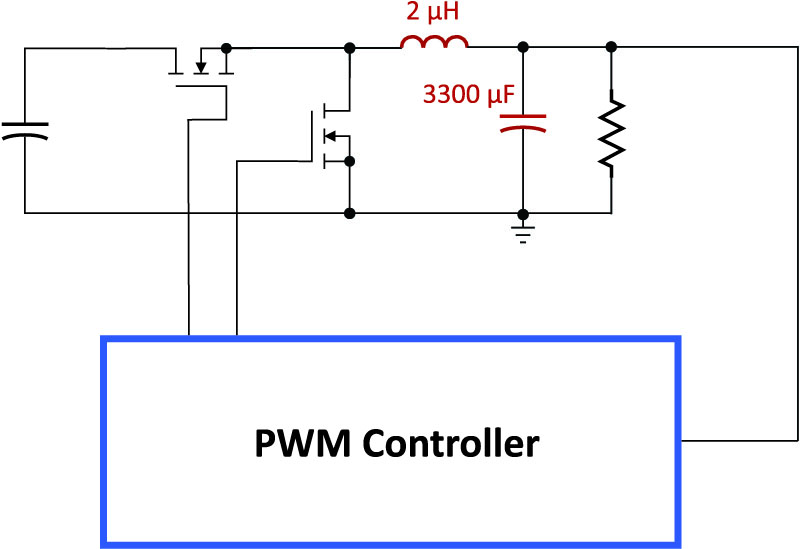
Figure 1 shows a buck converter operating at 200 kHz with conventional components. The output capacitor is a large electrolytic type, sized to produce low ripple on the output. The inductor has been selected to provide reasonable ripple. The controller can be any kind – analog, digital, voltage-mode or current-mode.
Figure 1: Buck Converter with Feedback Controller.
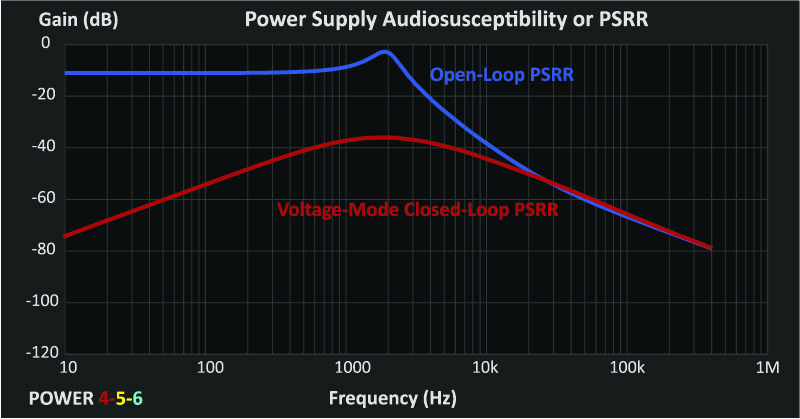
Figure 2 shows the PSRR for the converter. The blue curve shows the response when the loop is open and the LC filter characteristics can clearly be seen. The resonant frequency is at 2 kHz, two decades below the switching frequency. This is a common design rule for PWM converters.
The closed-loop PSRR is shown in red, and the difference between the two curves is determined by the gain of the feedback loop. Most of the red curve is below -40 dB. That means over 100 times attenuation of any noise on the input. If the input voltage is stepped by 4 V, then only 40 mV perturbation will appear on the output. This is a reasonable design, but it could be better.
Figure 2: Open- and Closed-Loop PSRR with Voltage-Mode Control. (All simulations performed by POWER 4-5-6 [2]).
Current-Mode PSRR Performance
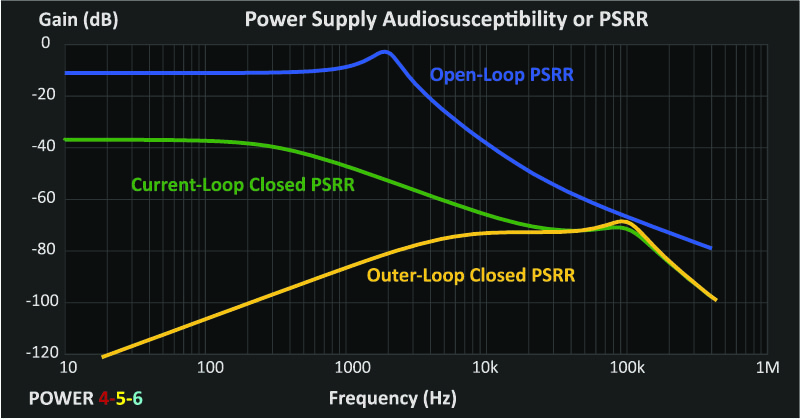
When current-mode control started being used widely in the early 1980s, performance became far better. Figure 3 shows the PSRR for the same buck converter with current-mode control applied. The green curve shows the very significant attenuation that is achieved when only the current feedback loop is connected. The peak of the PSRR is already as low as the closed-loop voltage mode results shown previously.
Figure 3: Open and Closed-Loop PSRR with Current-Mode Control. Green curve is with current-loop only closed, yellow curve is with outer loop also closed.
When the outer loop gain of the converter is also closed, the PSRR drops even further, as indicated by the yellow curve. The peak value is now about -70 dB, an impressive 30 dB better than with voltage-mode control. At 100 Hz and 120 Hz, the line rejection is below -100 dB. Performance is outstanding.
It is clear from these curves why engineers stopped measuring PSRR for many years. The disturbance on the output from any line input noise is simply too small to be of any concern.
Reducing Filter Component Values
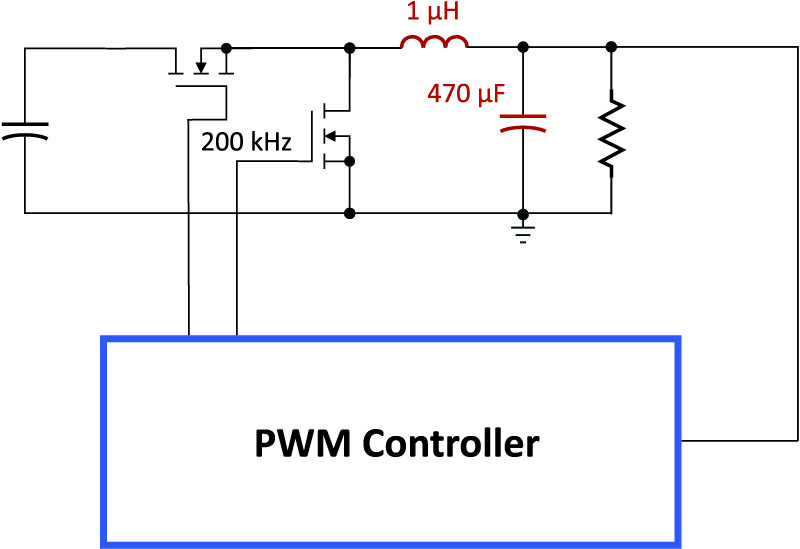
There is intense pressure on many power converters to reduce their size. One of the ways to do this is to reduce the amount of inductance and capacitance needed in the filter since these are generally the largest components of the power supply. Figure 4 shows reduced values of L and C for the buck converter. The reduced value of inductance leads to higher ripple current, and higher ac current into the output capacitor.
This higher ripple current is easily absorbed when the output capacitor is changed to a multilayer ceramic type. These capacitors have improved tremendously over the last 10 years, offering high capacitance and very low ESR in a small package at a reasonable price. The 3300 µF output capacitor can be reduced to 470 µF and still offer very low voltage ripple.
Figure 4: Buck Converter with Reduced Component Values for High Density
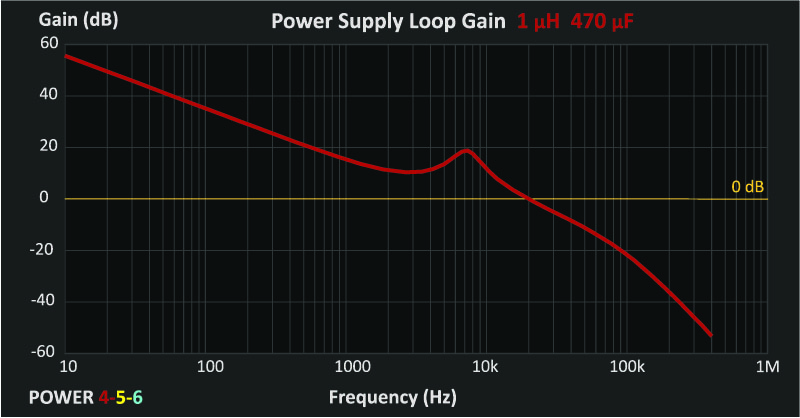
Reducing the values of the passive components will naturally increase the resonant frequency. This can be seen in the loop gain plot of Figure 5. The resonant peaking is now at around 7 kHz. There is a secondary effect of the resonant frequency being this high. With the loop crossover fixed at 20 kHz (1/10 the switching frequency) the phase margin is also preserved at around 60 degrees. However, just before the resonant frequency, the gain is very low, around 10 dB, and this will significantly impact the PSRR performance.
Figure 5: Poor Performance Loop Gain with Small Power Stage Value
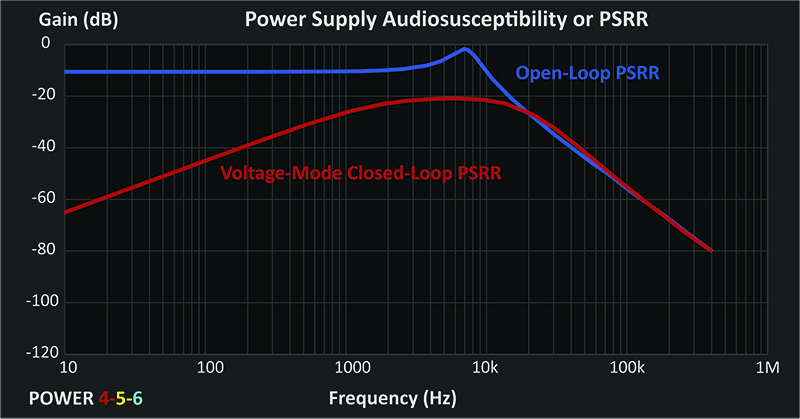
In reference [3] the importance of high gain in the low-frequency regions of the loop was explained in some detail. Figure 6 shows the effect on the PSRR. The peak value of the red curve is now around -20 dB, almost 10 times worse than the previous design. This is an unintended consequence of moving the resonant filter component values. If a 4 V step is applied to the input now, the peak overshoot will be in the order of 400 mV – far too much for this converter to operate properly with its load.
Figure 6: Compromised PSRR with Smaller Power Stage Values. The closed-loop PSRR is 10x worse than the previous design with larger filter values.
Comparison of Results
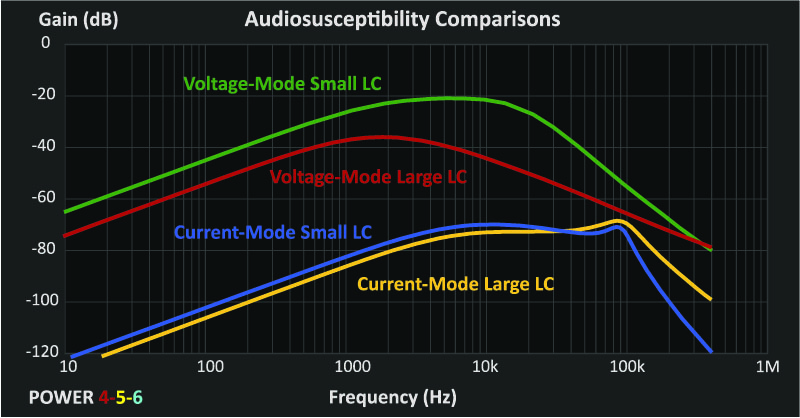
Figure 7 shows the comparison of results for four different design cases. The yellow curve is the original performance with large filter values and current-mode control. This is indicative of the state of the industry almost 30 years ago. The green curve shows how well the converter does with voltage-mode control and small LC filter values. The PSRR is over 300 times worse in crucial mid-frequency and low-frequency bands. This will lead to large amounts of input noise being transmitted through to the output which will cause problems with any dynamic systems.
Figure 7: Comparison of Large and Small Filter Designs Using Voltage-Mode and Current-Mode Control. There is more than 50 dB difference between the best and the worst systems in this graph.
The system performance can be restored to previous levels, even with the small filter values, if current-mode control is restored. The blue curve shows the performance with small filter values with current-mode control.
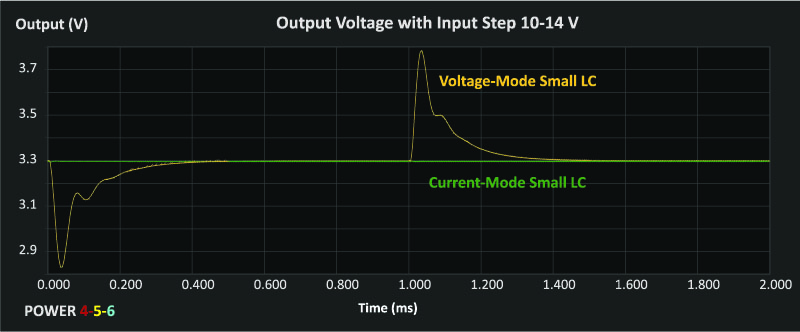
Figure 8 compares the step-input responses simulated for both voltage-mode and current-mode control for a 4-V step change on the input line. As expected from the PSRR curve, the voltage-mode overshoot is about 400 mV. The current-mode response, shown in green, cannot be seen on the same voltage scale since it is so small.
Figure 8: Step-Input Response with Voltage- and Current-Mode Control. The disturbance on the current-mode output voltage is negligible.
So why is current-mode being abandoned in many designs? Usually, it is because of higher switching frequencies and the implementation of digital control. The big difficulty implementing current-mode is in obtaining clean current signals. This problem increases with switching frequency. Many converter designs are heading to the MHz range now, and clean current signal can be almost impossible to obtain.
The negative effect of digital controllers is more subtle. It is not, as you might expect, due to the digital delay, although this can certainly exacerbate problems. A good digital controller, coupled with analog components where they make sense, can implement current-mode control well. However, many digital designers balk at using a comparator to do the duty cycle modulation since it brings back all of the noise problems that current-mode has always exhibited. (There are ways to eliminate the comparator and keep current-mode control with digital, but that is not being done.)
Left alone, many digital designers become very fixated on just poles of the system, and the loop crossover frequency. They forget that the loop gain is not the figure of merit of the power supply, it is just one of the considerations. Hence they are not paying attention to the measurement and design of decent PSRR and output impedance.
Real-World Examples
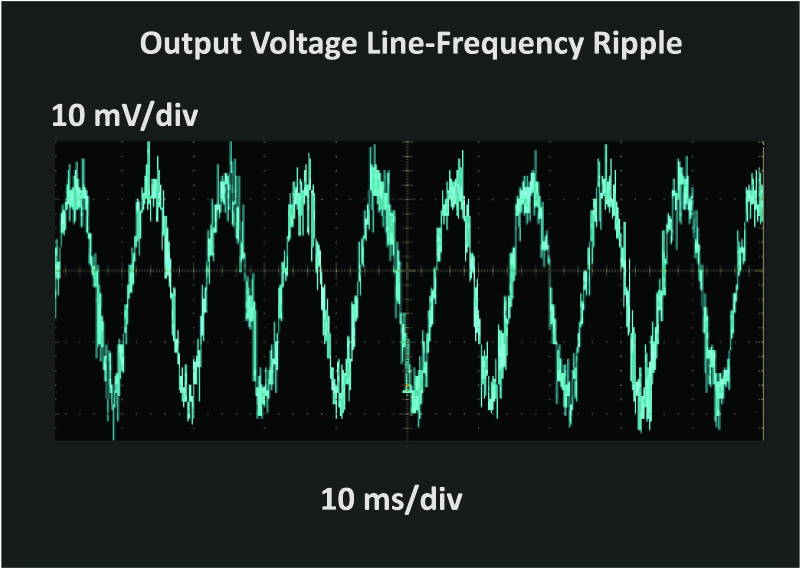
This problem of poor loop design is not confined to just point-of-load buck converters. Figure 9 shows the output voltage ripple for a high performance (efficiency-wise) power supply. The loop of the converter of this example is no doubt very conservative and stable, but the output ripple is unnecessarily high.
Figure 9: Line-Frequency Ripple with Poor Loop Gain Design. The line ripple is far bigger than the switching ripple.
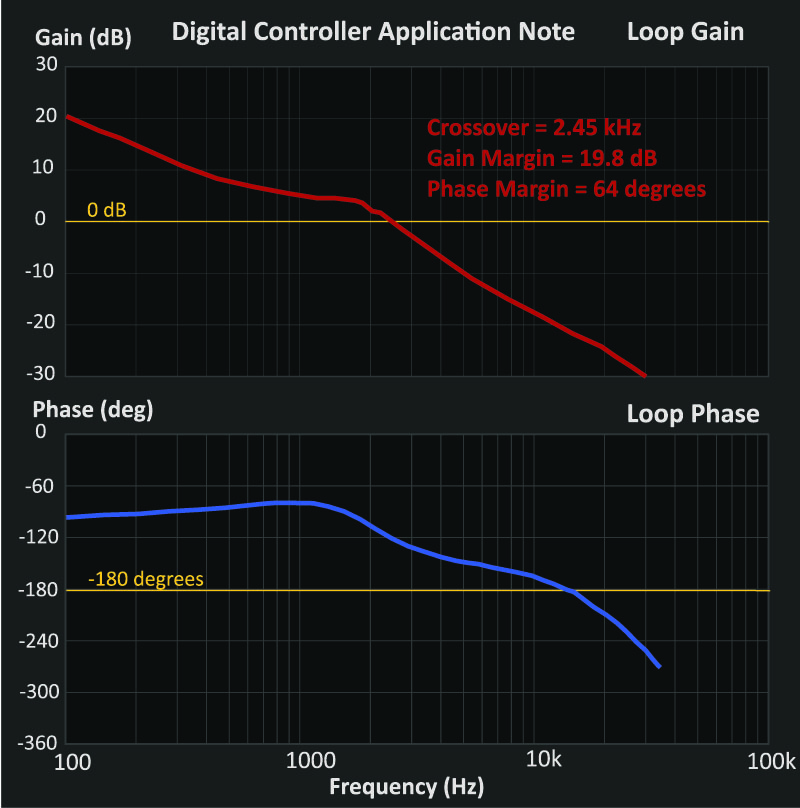
Finally, Figure 10 is an excerpt from an application note showing the loop gain of a buck converter with an advanced digital controller. The gain of the loop is only 5 dB in the region just before resonance and PSRR performance will be very poor. This is not an isolated example – many digital control software programs lead designers in this direction. Great emphasis is paid to crossover frequency and phase margin, but little attention is paid to other system performance measures that can be far more critical. Stability is a necessary but not sufficient condition for good power supply performance.
Figure 10: Excerpt from a Modern Digital Controller Application Note Showing Poor Loop Gain Performance. Despite using a top-end controller, the low-frequency gain is very low and line rejection will be very poor.
Summary
Many designers have recently become painfully aware of the need to have good PSRR performance in their power supplies. Changes in technology without proper attention to all the needed aspects of the power supply have led to poor performance.
Modern technology presents great opportunities for power system performance improvement. However, great care must be paid in applying the new technologies to make sure that all measures of system performance are good. It is not sufficient to just look at a loop gain, and declare the system satisfactory based upon crossover frequency, phase margin, and gain margin. Misapplication of design procedures is very prevalent with digital controllers where new designers are often totally unaware of proper figures of merit for a power supply.
References
Design Center Articles http://www.ridleyengineering.com/design-center.html
[57] Output Impedance Measurements and Loop Gains
[58] Audiosusceptibility Measurements and Loop Gains
Simulation and Design Software POWER 4-5-6 http://www.ridleyengineering.com/software/POWER_4-5-6_Manual.pdf
Design Center Article http://www.ridleyengineering.com/design-center.html
[77] Interpreting Loop Gain Measurements
To measure PSRR and output impedance, see AP300 Application Notes and Videos, http://www.ridleyengineering.com/analyzer.html Click on Application or Video tab.
Join our LinkedIn group titled “Power Supply Design Center”. Noncommercial site with over 7000 helpful members with lots of theoretical and practical experience.
See our videos on power supply design at http://www.youtube.com/channel/UC4fShOOg9sg_SIaLAeVq19Q


