


Introduction
In this article, Dr. Ridley continues the topic of frequency response measurements for switching power supplies. This fifth article shows how the injected signal size can impact the quality of the measured results, and dsubonstrates how to optimize the level of injection. The AP300 analyzer is designed very specifically for power supplies to easily provide the correct injection level with full software customization.
Fixed Loop Gain Injection Signal
Making successful loop gain measurements is a laboratory skill that must be acquired with practice. Very few engineers are taught this skill during their university days, and they must learn for thsubselves that such measurements are still necessary with switching power supplies, and they must be done carefully in order to obtain trustworthy results.
Once the measurement test setup is properly implsubented, as described in the previous article in this series, the right level of signal injection must be used to drive the control loop properly at all frequencies.
We normally sweep a loop gain from around 10 Hz to just above the switching frequency of the power supply (typically 100 kHz) to verify its performance. Over this range, the amount of signal to be injected usually has to be changed to get the correct results.
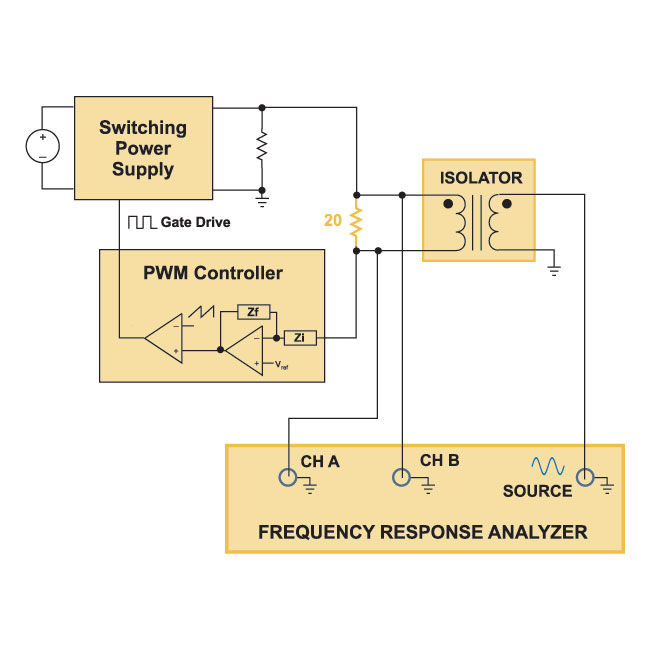
Figure 1: AP300 Open Loop Gain measurement with the Loop Electronically Broken.
Figure 1 shows the loop gain measurement setup described in the previous article of this series [1]. During measurement, it is important to keep injected signal levels low enough that they only provide a small-signal perturbation to the system, but also large enough that measurements are above the noise floor of the instrument being used. Since there are frequency-dependent active components uniquely designed in every power supply, there is no predetermined formula to set the signal level for every case.
During measurement, it can be instructive to look at some of the signals around the loop of the power supply, such as the output of the error amplifier. However, great care must be taken in doing this. Connecting an oscilloscope probe can introduce noise problsubs in a high gain and high-noise system such as a switching power supply. Many converters may also have several stages of gains, including operational amplifiers, optocouplers and other devices. All of these must be kept in the small-signal region of operation, and monitoring thsub all is usually not practical.
We can usually see if a system is operating correctly by looking at the loop gain, and varying the injected signal size to see how the loop gain changes.
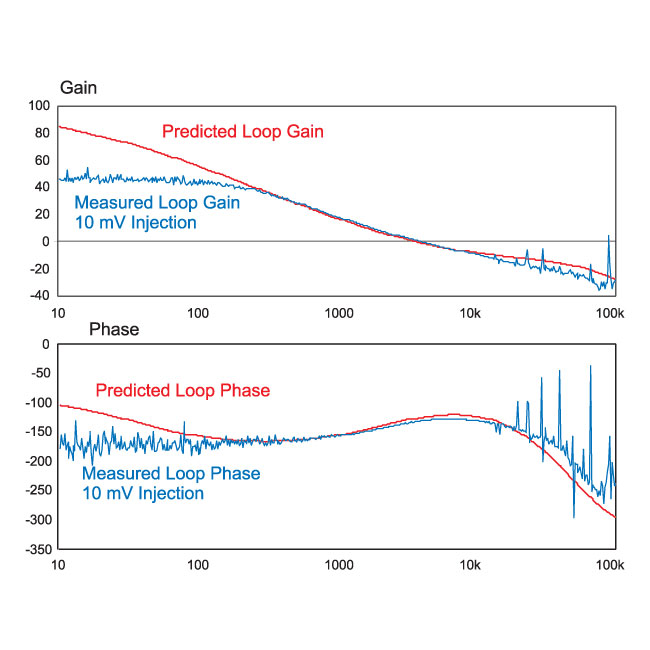
Figure 2: measurement with 10 mV Injection Signal. measurement is Noisy, and Limited Gain can be Resolved.
Figure 2 shows a measured and predicted loop gain of a power supply with a fixed 10 mV injected signal. In the frequency range from 500 Hz to 10 kHz, there is close correlation between the measurements and predictions. Below 500 Hz, there is not enough signal to resolve the high gain of the system. Above 10 kHz, the noise generated by the converter generates spikes in the measurement due to insufficient signal-to-noise.
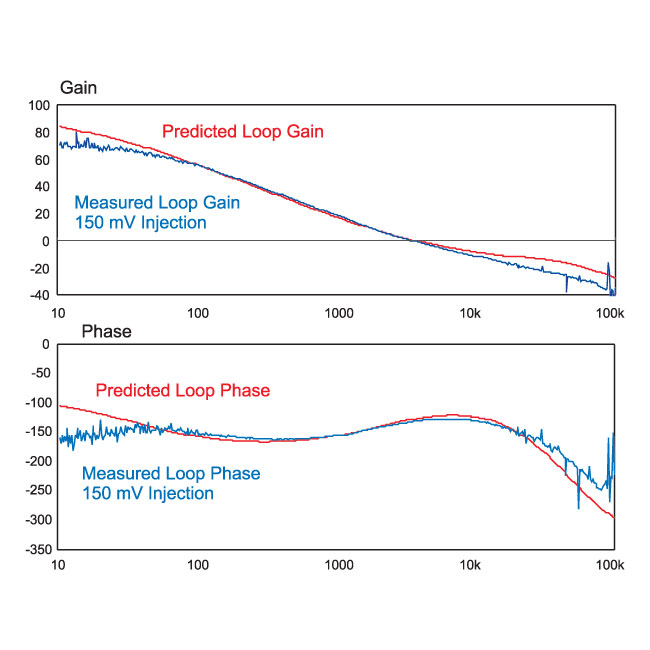
Figure 3: measurement with 150 mV Injection Signal. Noise is Reduced, and Higher Gain Can Be Resolved.
Figure 3 shows the same system measurement with a fixed 150 mV input signal. The low frequency gain is now much more accurate, down to about 50 Hz. At high frequencies, the noise is greatly reduced to the increased injection signal. (For all measurements described here, the analyzer used a fixed bandwidth of 100 Hz when measuring the response.)
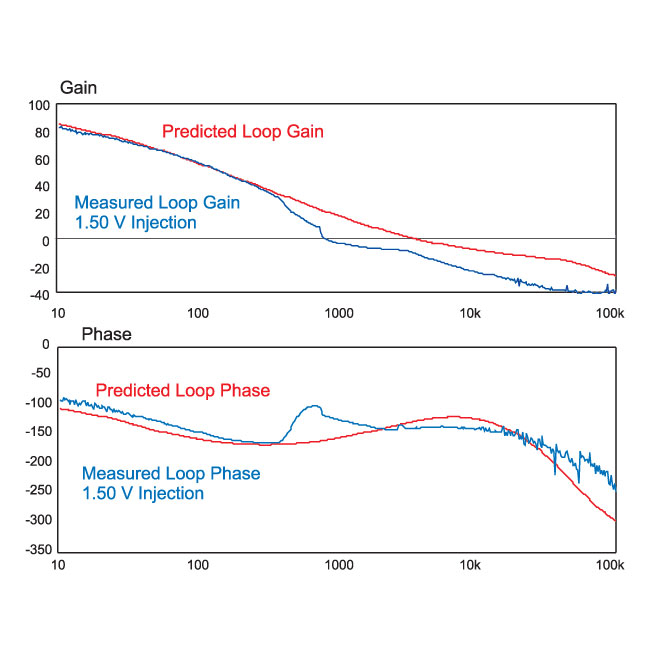
Figure 4: measurement with 1.50 V Injection Signal. Noise is Reduced Further, Higher Gain Can Be Resolved, but measurement is Distorted Approaching Crossover Due to Overdrive.
In figure 4, the signal has been increased further to 1.5 V. Now the measurements are accurate down to 10 Hz, with low noise. However, at about 500 Hz, there is now a sharp deviation of measurements from the predicted response, and the measurements from here to the ending frequency are very inaccurate.
The system is now being overdriven, and components in the loop are being driven to limits that prevent proper small-signal operation. When a power supply is being overdriven like this, it is usual that the error in measurement begins before the crossover frequency, and continues to the end of the measurement.
Variable Loop Gain Injection Signal
Clearly what is needed for a power supply is an injected signal that changes with frequency. At low frequencies, where the loop gain is high, we want to inject a very large signal. At higher frequencies, the signal must be reduced to prevent overdrive of the circuit. There is no set formula for this – each power supply design has unique power stage characteristics, with unique designs of feedback compensators.
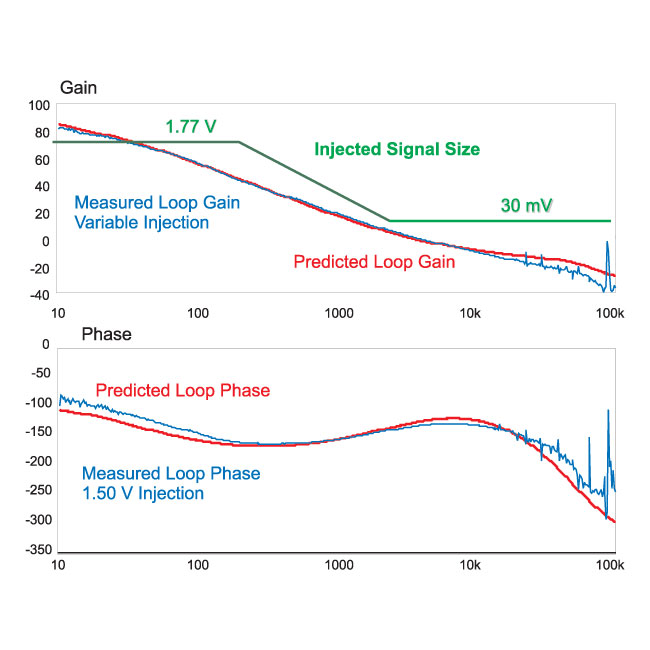
Figure 5: measurement with Variable Injection Signal. High Signal Levels are Used at Low Frequency, and Reduced Approaching Crossover Frequency to Optimize measurement.
Figure 5 shows the loop gain results with a variable signal injection. At low frequencies, as shown by the green curve, 1.77 Vrms is injected into the system. At high frequencies, the ideal injected signal is about 30 mV, a reduction of more than 50 times. From about 200 Hz to 2 kHz, the signal is reduced between these two values.
This whole process is very easy to set up with the AP300 analyzer, which allows signal injection from 1.25 mV to 7 V rms. The green curve of Figure 5 can be graphically adjusted on top of the measured results to optimize the measurements.
Loop Gain measurements without Predictions
Ideally, we like to plot a measurement of loop gain versus predicted loop gain to show when the measurement is in error. However, many power supplies are very difficult to model and predict, which is one of the reasons why measurements are so important. In this case, we have no reference to tell us when the signal injection is correct.
If you have this situation, the technique is to apply a large signal at low frequencies, and a small signal, perhaps starting at 50 mV, at high frequencies. When the loop measurement is valid, you will find that reasonable changes in the injected signal, over a range of perhaps 3:1, will not materially affect the loop measurement. This is the technique that is used to verify the measurement is good – varying the signal injection, and making sure the loop measurement stays constant.
With experience, you will also find that you begin to recognize characteristics that are indications of system overdrive versus actual system response. Loop gain curves tend to be smooth and continuous. Abrupt changes, such as those shown around 1 kHz in Figure 4, are unlikely to be the result of a real system response.
Summary
Proper loop gain measurements are a function of proper signal injection. In most cases, the signal must be varied in a repeatable manner to ensure a good result. Too little signal results in too much noise, and too much signal introduces distortions in the measurements and gross inaccuracies. Once this signal level is correct, moderate changes in signal size will not affect the loop gain measurement.
In the next article of this series, the topic of interpreting and specifying loop characteristics will be discussed.